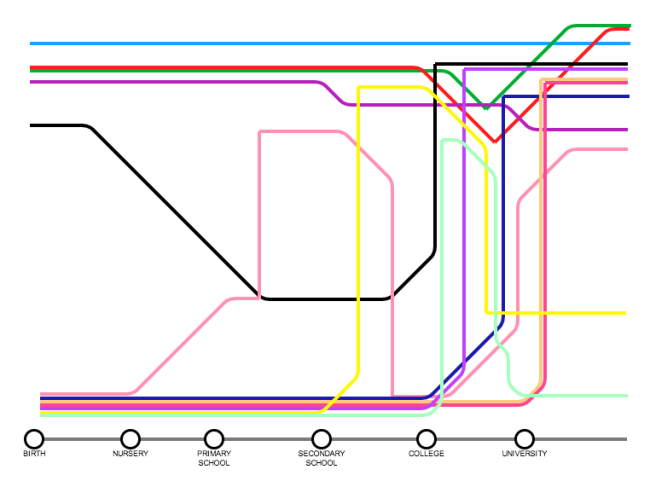
For our task in Design Practice 2 we were instructed to create a piece of info-graphics which described various relationships throughout our lives. Here I decided to create my piece in the style of a tube map, which not only describes the relationships through the height of the lines (highest being a good relationship) but also describes my relationships as a journey. I used different colours to distinguish between different lines and I have measured my relationships from when I was born and through my school years, as I associate my relationships with these particular periods the most. I found this task not only interesting but theraputic, however at times I also found it difficult.

- Comment
- Reblog
-
Subscribe
Subscribed
Already have a WordPress.com account? Log in now.
%d
